Biography
Biography: Gerald C. Hsu
Abstract
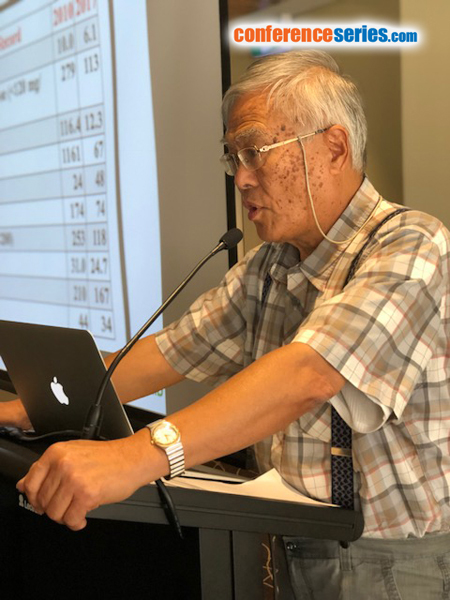
Based on his research, the author developed two prediction tools and was able to reduce his PPG from 380 mg/dL to 116 mg/dL, daily glucose from 279 mg/dL to 117 mg/dL, and A1C from 10% to 6.1%
He examined correlations between PPG and three known major factors, medication, carbs and sugar intake, exercise, and other secondary factors, including stress/tension, measurement time delay, traveling, illness, sleep disturbance, seasonal weather, etc. In summary, more than 20 elements were considered and over 1 million data collected.
During 934 days (from 6/1/2015 to 12/21/2017), he had 2,802 meals and collected about 60,000 PPG-related data. The conclusions were: +60% correlation between PPG and carbs and sugar intake (average 14.7 gram and 38% contribution rate); - 64% correlation between PPG and post-meal walking (average 4,300 steps and 43% contribution rate). Collectively, these secondary factors account for approximately 19% (weather has contributed 10%) of the predicted PPG values.
Those collected 2,800 meal photos were analyzed against 6 million food data collected and re-processed from US government and stored in cloud server. All food data were sorted according to country, franchise restaurants, individual cafes,
home-cooked meals, airline food, etc. Here are some examples:
Airline food - 136 mg/dL; Restaurant food - 127 mg/dL; Home
Cooking - 111 mg/dL.
The predicted PPG (115.5 mg/dL) vs measured PPG (120.5
mg/dL) has a linear accuracy rate of 96% and 87% correlation.